Construction Financial KPIs: 2026 Strategic Framework

Updated: 6 days ago
Would you still sign that high-profile contract if you knew your entire profit margin would be erased by a 35% spike in steel prices before the first shovel hit the ground? In 2026, high revenue doesn't guarantee stability; it often masks the silent erosion of your working capital. Many contractors find themselves moving massive amounts of cash while still worrying if they'll have enough to meet next month’s payroll. Mastering specific financial KPIs for construction companies is no longer just an administrative chore. It's the structural blueprint required to protect your firm from shrinking margins and the trap of inaccurate job costing.
We understand that the complexity of project-based accounting can feel like a constant battle against invisible leaks. You deserve a clear dashboard of health indicators that provides total certainty over every dollar. This guide outlines a strategic framework to optimize your cash flow and transform your firm into a data-driven powerhouse. We'll explore how to leverage historical data for confident bidding, improve your bonding capacity, and build the financial readiness that lenders demand. It's time to move beyond basic data entry and start building a foundation for permanent structural health.
Beyond the Balance Sheet: Why Construction Requires Specialized Financial KPIs
Standard accounting is often like looking at a building's facade without inspecting the foundation. For a retail shop, a profit and loss statement is straightforward. In our industry, it's a complex maze of timing differences and shifting costs. You might see a healthy balance in your bank account after a large project deposit, but that cash is often already committed to future materials and labor. This is the "Cash vs. Accrual" trap that catches many contractors off guard. To maintain control, you must look beyond the surface level of your ledger.
A Key Performance Indicator (KPI) in the construction context is a quantifiable measure of both project-specific and firm-wide health. These metrics provide the clarity needed to understand your true financial position at any given moment. Without tracking specialized financial KPIs for construction companies, you risk making major decisions based on incomplete or misleading data. The foundation of this accuracy is the Work in Progress (WIP) report. This document reconciles what you've billed against the actual costs you've incurred, providing the structural integrity your financial reporting needs. Specialized KPIs are necessary for contractors to reconcile actual field progress with ledger balances, ensuring they don't fall victim to "phantom profits" that vanish once final bills arrive.
The Problem with Generic Financial Statements
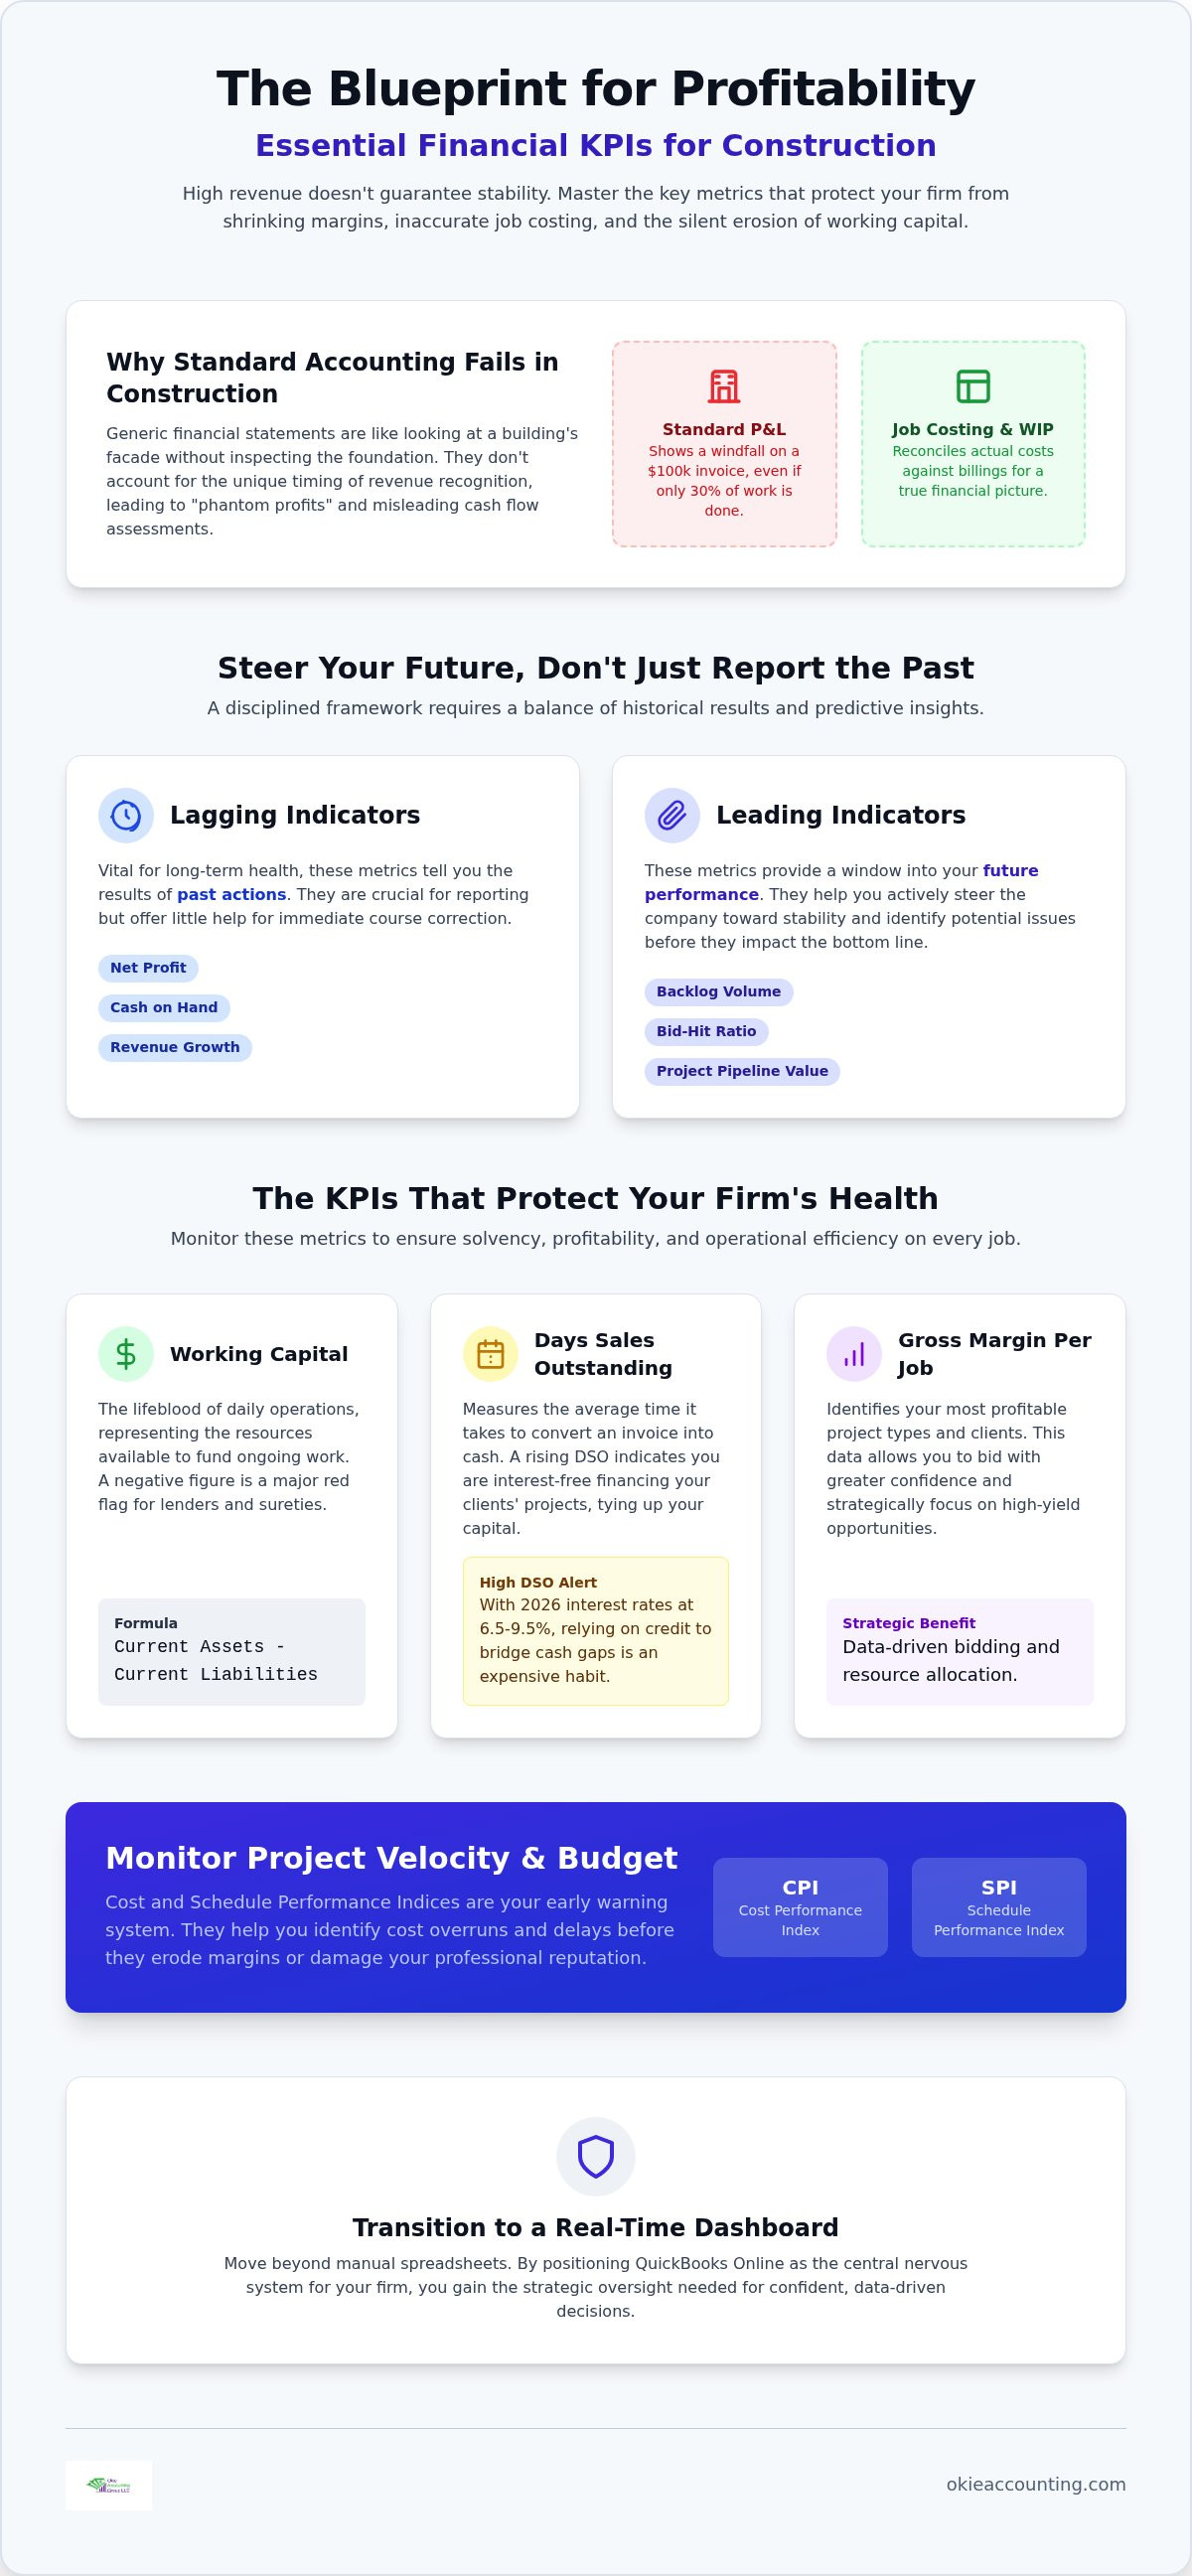
Generic financial statements frequently fail because they don't account for the unique timing of revenue recognition in construction. If you send an invoice for $100,000 but have only completed 30% of the work, a standard P&L might show a windfall that hasn't been earned. Job costing is the critical missing link here. It allows you to track expenses against specific contracts in real time. By transitioning from basic administrative tasks to management accounting, you gain the ability to spot budget overruns while there is still time to correct them. This proactive oversight is what separates a struggling firm from a profitable powerhouse.
Leading vs. Lagging Indicators in Construction
A disciplined framework requires a balance between two types of data. Lagging indicators, such as net profit and cash on hand, tell you the results of past actions. They are vital for long-term health but offer little help for immediate course correction. Leading indicators, like your backlog volume and bid-hit ratio, provide a window into the future. If your bid-hit ratio is unusually high, you may be underbidding your projects. If your backlog is shrinking, your revenue will inevitably follow. Tracking both ensures you aren't just reacting to the past but are actively steering toward future stability.
Liquidity Metrics: Protecting Your Firm’s Cash Flow and Solvency
Liquidity isn't just about having cash in the bank; it's about the precise timing of when that cash is available to meet your obligations. In a sector where pay cycles often stretch beyond 60 days, understanding your liquidity metrics is the only way to avoid a solvency crisis. These specific financial KPIs for construction companies serve as an early warning system, signaling whether you have the fuel to mobilize for the next project or if you are overextended. With interest rates for professional builders ranging from 6.5% to 9.5% in 2026, relying on lines of credit to bridge cash gaps has become an expensive habit that erodes your bottom line.
Monitoring your Days Sales Outstanding (DSO) is particularly critical in this environment. This metric reveals the hidden cost of slow-paying owners or general contractors by measuring how long it takes to convert a completed invoice into actual cash. A rising DSO often indicates that your capital is being used to interest-free finance your clients' projects. To gain a deeper understanding of how to shorten these cycles, you may want to explore our guide on mastering construction cash flow management for tactical advice on billing structures.
Calculating and Improving Working Capital
Working capital is the lifeblood of your daily operations, calculated by subtracting current liabilities from current assets. It represents the net resources available to fund your ongoing work and support future growth. A negative working capital figure is a significant red flag for sureties and lenders, as it suggests you may struggle to meet short-term debts. To maintain a healthy position, focus on accelerating your billing cycles and negotiating better terms with vendors. This structural discipline ensures you remain "bondable" and ready for high-value opportunities. If you find your current systems aren't providing this level of clarity, a discovery call can help identify the gaps in your financial reporting.
Monitoring the Quick Ratio
While the current ratio provides a broad view of solvency, the Quick Ratio offers a more conservative and realistic perspective. It excludes inventory and prepaid expenses, focusing only on cash, short-term investments, and accounts receivable. This metric is essential for measuring immediate solvency because you cannot pay your crew with unsold materials or uninstalled equipment. According to industry insights on Essential Construction Finance KPIs, maintaining a ratio of at least 1.0 is a standard benchmark, though specialty contractors often aim higher to account for retainage delays. Utilizing fractional controller services can help you maintain these ratios by providing the high-level oversight needed to manage complex balance sheets without the cost of a full-time executive.
Project Performance KPIs: Tracking Cost and Schedule Variances
Project performance isn't just about the final check. It's about the daily velocity and efficiency of your field teams. While liquidity metrics tell you if you can pay your bills, project-specific financial KPIs for construction companies tell you if those projects are actually generating the profit you expected. By the time you see a loss on your final P&L, it's too late to fix the problem. This is why we prioritize leading indicators like the Cost Performance Index (CPI) and Schedule Performance Index (SPI). These metrics act as a compass, ensuring you're getting a dollar's worth of work for every dollar spent. To calculate these accurately, you must maintain rigorous WIP accounting for construction, as it provides the real-time data needed to compare actual costs against earned value.
The Cost Performance Index (CPI) is a simple but powerful ratio: Earned Value divided by Actual Cost. If your CPI is 1.0, you're exactly on budget. If it's 0.85, you're spending $1.00 to get $0.85 worth of work. This immediate visibility allows you to investigate field issues, whether it's material waste or labor inefficiencies, before they compound. Similarly, the Schedule Performance Index (SPI) measures your velocity. An SPI below 1.0 means your project is behind schedule, which usually leads to increased overhead or liquidated damages. Tracking these financial KPIs for construction companies ensures that "phantom profits" don't mask a failing project until it's too late to intervene.
Understanding Earned Value Management (EVM)
Earned Value Management (EVM) is the structural framework that prevents the dreaded "90% complete surprise," where a project suddenly looks unprofitable in the final weeks. This method relies on three variables: Planned Value (the budget for scheduled work), Actual Cost (what you've spent), and Earned Value (the budget for work actually performed). By comparing these, you identify variances while there's still time to adjust your field operations. A CPI over 1.0 indicates that your project is currently running under budget, providing a clear signal of operational health and team efficiency. This disciplined approach moves you away from "bank balance accounting" and toward true strategic oversight.
Labor Productivity and Efficiency
Labor is the most volatile variable in any construction budget. Tracking labor productivity through "Revenue per Man-Hour" allows you to identify which crews are your top performers and where downtime is eroding your profits. This isn't just about monitoring hours; it's about measuring the value created in those hours. If one crew consistently generates more revenue per hour than another on similar tasks, you have a data-driven reason to investigate their methods or provide additional training to others. Using QuickBooks for contractors properly allows you to tag labor costs to specific job stages, giving you granular visibility into where you're winning or losing on the job site. This level of data integrity transforms payroll from a generic expense into a strategic performance metric that protects your bottom line.
Profitability and Efficiency: Maximizing Revenue per Project
High revenue is often a vanity metric that masks deep operational flaws. In the construction sector, it's entirely possible to be "busy" while simultaneously going out of business. If your margins don't hold up, you are essentially running a high-volume non-profit. Integrating these financial KPIs for construction companies allows you to distinguish between projects that merely cover costs and those that drive growth. With steel prices projected to rise by 15-35% and lumber by 20-40% in 2026, your ability to capture every dollar of profit depends on the structural integrity of your job costing data. You must know exactly what is left for the owners after overhead is cleared and the field teams are paid.
A disciplined approach to financial KPIs for construction companies also requires looking at the balance sheet through the lens of over and under-billings. Under-billings, or costs in excess of billings, represent revenue you've earned but haven't invoiced. This is an asset, but it's a dangerous one because it consumes your cash flow. Over-billings, or billings in excess of costs, provide a cash cushion but represent a liability of work yet to be performed. Balancing these two figures is the only way to ensure your reported profits are real rather than just temporary cash timing advantages.
The Critical Nature of Gross Margin
Gross profit margin per job is the ultimate indicator of your bidding accuracy and field efficiency. While residential contractors might target margins of 20% to 30%, commercial firms often operate in the 10% to 15% range. If your actual margins consistently fall below your estimates, you have a systemic leak in your production or procurement process. Utilizing construction bookkeeping services ensures that every bolt, hour, and permit is accurately captured against the correct job. This level of granular detail allows you to identify your "cash cow" project types and pivot away from sectors that erode your bottom line.
Tracking Backlog for Future Stability
Your backlog is a leading indicator of your firm's long-term health. By calculating your "Months of Backlog," you can determine how long your current staff and equipment can stay productive without winning a single new contract. This data is essential for making informed decisions about hiring new crews or investing in heavy equipment. If your backlog to equity ratio is too high, you may be over-leveraged and at risk of a "digestive" failure if a project stalls. A fractional controller provides the strategic oversight needed to interpret these trends, helping you scale with confidence rather than guesswork. To begin building a dashboard that tracks these critical metrics for your firm, you can schedule a discovery call with our team today.
Implementing a KPI Dashboard: From Data Entry to Strategic Oversight
Relying on manual spreadsheets is the fastest way to lose sight of your profitability. When your data is trapped in disconnected tabs, it becomes fragmented, outdated, and prone to human error. To truly master financial KPIs for construction companies, you need a system that updates in real time. We view QuickBooks Online not just as a bookkeeping tool, but as the central nervous system of your entire operation. It's the engine that pulls together your field labor, material costs, and billing cycles into a single, cohesive picture of your firm's health.
Moving beyond basic administrative tasks requires a shift toward advanced controller services. This transition allows you to stop looking at what happened last quarter and start predicting what will happen next month. However, a dashboard is only as strong as the data fueling it. Professional software training empowers your team to maintain data integrity at every level. When your project managers and office staff understand how their inputs affect your KPIs, you create a culture of financial accountability that protects your bottom line.
Setting Up Your Cloud Accounting Infrastructure
Building a scalable financial framework starts with a disciplined setup. Follow these three steps to ensure your data is ready for strategic analysis:
Step 1: Standardizing your Chart of Accounts. You must align your ledger with your job costing needs. This ensures that every expense is categorized in a way that makes project-specific analysis possible.
Step 2: Implementing automated time tracking. Manual time cards are a primary source of data leakage. Using cloud-based field reports allows labor costs to flow directly into your job costs without delay.
Step 3: Integrating project management tools. Connecting your PM software with QuickBooks eliminates double entry. This creates a seamless bridge between field operations and financial reporting.
The Monthly Financial Review Process
A monthly deep dive into your KPIs is non-negotiable for sustainable growth. This isn't a casual check of your bank balance; it's a rigorous examination of your variances. You must identify why a project's CPI dropped or why your DSO is creeping upward while there's still time to intervene. By investigating these anomalies immediately, you prevent small field issues from becoming firm-wide solvency crises. Partnering with Okie Accounting Group provides the proactive financial leadership you need to interpret these trends. We don't just deliver reports; we provide the structural oversight that transforms your data into a powerful tool for long-term stability and profit protection.
Building a Foundation for Permanent Profitability
Transitioning from reactive bookkeeping to proactive strategic oversight is the only way to safeguard your firm's future in an increasingly volatile market. By mastering specific financial KPIs for construction companies, you move beyond basic administrative tasks and gain the clarity needed to protect your margins. You've learned how liquidity metrics preserve your cash flow, how project indices prevent mid-job surprises, and how a cloud-based dashboard serves as the central nervous system for your entire operation.
This structural framework provides more than just data; it offers the confidence to bid larger projects and the readiness to meet lender requirements. You don't have to navigate these complexities alone. Our specialized construction expertise and focus on cloud-based efficiency ensure your financial systems are built for long-term stability. By providing strategic growth oversight, we help you transform your firm into a data-driven powerhouse. Gain Financial Clarity with Okie Accounting’s Fractional Controller Services and secure the professional partnership your business deserves. Your path to operational clarity starts with a single, disciplined choice.
Frequently Asked Questions
What is the most important financial KPI for a construction company?
While liquidity is vital, the Work in Progress (WIP) adjusted Gross Profit Margin is the most critical metric for long-term health. It ensures you aren't just moving cash but are actually earning a profit on every contract. This KPI accounts for the timing of costs and billings, providing a true reflection of project performance that generic reports often miss. It's the foundation of any structural financial framework.
How often should a contractor review their financial KPIs?
You should conduct a comprehensive review of your financial KPIs for construction companies at least once a month. This monthly cadence allows you to catch project variances while there is still time to intervene. For high-velocity projects or firms with tight cash flow, a weekly pulse check on labor productivity and cash on hand is often necessary to maintain operational control and protect your margins.
What is a good net profit margin for a construction business?
A good net profit margin depends heavily on your specific sector and overhead structure. In 2026, many commercial general contractors target a net profit of 2% to 4%, while specialty subcontractors and residential builders often aim for 5% to 10% or higher. These benchmarks reflect the higher risk and specialized labor required in those niche markets compared to high-volume commercial work where margins are thinner.
How do I track KPIs if my bookkeeping is messy?
You cannot track reliable KPIs until you establish a clean data foundation. The first step is a comprehensive cleanup of your ledger and a transition to a structured cloud-based system like QuickBooks Online. Once your historical data is accurate and your chart of accounts is standardized, you can begin extracting the meaningful financial KPIs for construction companies that drive strategic decision-making and long-term stability.
What is the difference between a Current Ratio and a Quick Ratio in construction?
The Current Ratio measures all short-term assets against liabilities, while the Quick Ratio is a more conservative measure of immediate solvency. The Quick Ratio excludes inventory and prepaid expenses because you can't pay your crew with uninstalled materials. For contractors, the Quick Ratio provides a clearer picture of whether you can meet your obligations without relying on future project progress or material liquidations.
How does Work in Progress (WIP) affect my financial KPIs?
Work in Progress (WIP) accounting is the mechanism that corrects your profit and loss statement for over and under-billings. Without a WIP report, your KPIs will be skewed by the timing of your invoices rather than the actual progress of your work. WIP adjustments ensure that your revenue recognition matches your field production, preventing the phantom profits that often lead to sudden cash flow crises.
Can I track construction KPIs using QuickBooks Online?
Yes, QuickBooks Online is an excellent tool for tracking construction KPIs when it is configured correctly for job costing. By utilizing the Projects feature and classes, you can track revenue and expenses at the granular level required for CPI and SPI calculations. Proper setup ensures that your data is captured in real time, moving you away from manual spreadsheets and toward true strategic oversight.
Why do lenders care about my backlog to equity ratio?
Lenders and sureties analyze your backlog to equity ratio to assess your firm's capacity to absorb potential losses. If your backlog is too high relative to your equity, it signals that you may be over-leveraged and at risk if a project stalls or costs spike. Maintaining a healthy ratio demonstrates that you have the financial strength to complete your committed work while remaining bondable for future growth.


Comments